|
Stratification
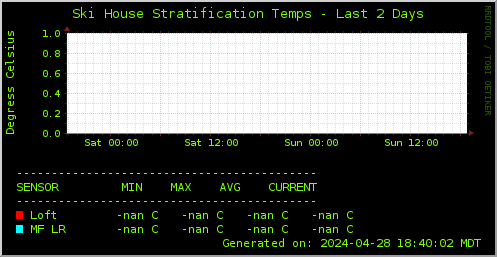
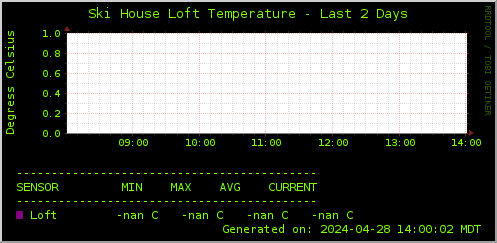
The following graph shows the temperature in the loft (red line and area), and the temperature in the living room below (blue area).
Optimal temps are about 9C when not occupied, and 15C when occupied.
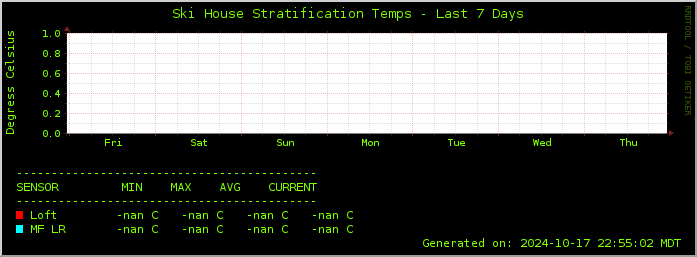
Here is a look over the past week.
You will likely see a slight area of red starting right around 11am, dropping off late afternoon.
That is showing the effects of the sun. If there is no red, it was likely a cloudy day.
Note, for a time reference, the day designator is lined up at noon.
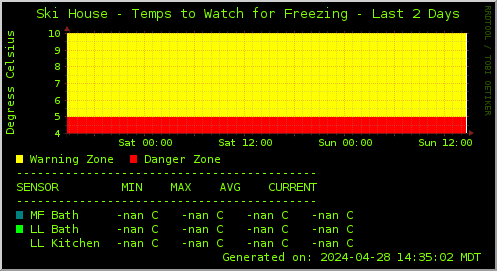
Protect from Freezing
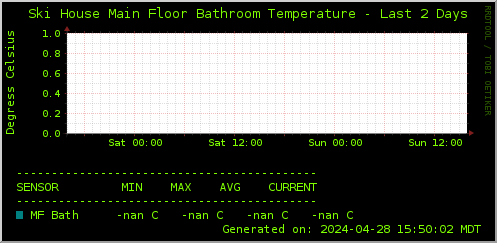
The following graph shows the areas where there are water pipes.
These should be kept around 10C and up, regardless of whether they are occupied.
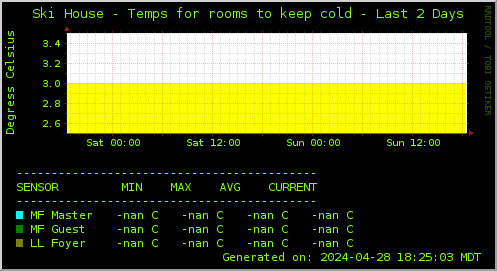
Don't Waste Heat
The following graph shows the areas where there are NO water pipes.
These rooms can be fairly cold, but should be above 3C
The first graph is a bit of a mess, and shows all the sensors, as well as the Electric usage.
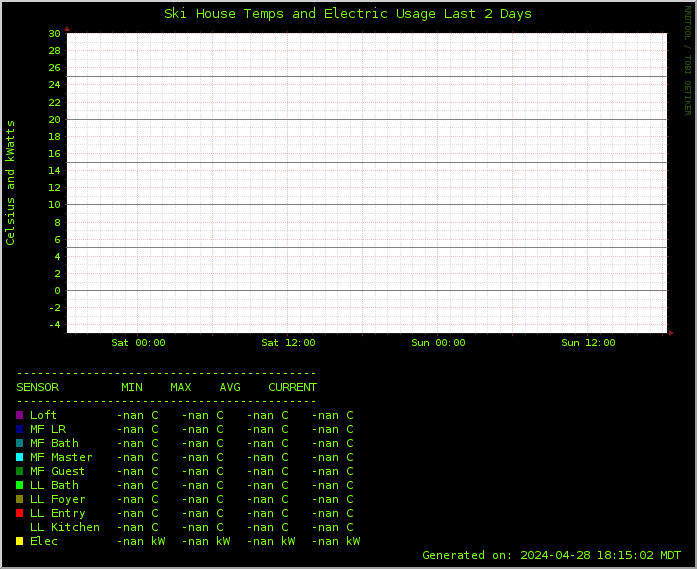
Here are individual graphs for each sensor:


| 